
Explore the 7 best Databox alternatives in 2027. Compare features, pricing, benefits, and use cases to find the right analytics and reporting tool for your business.
Businesses rely on accurate data to understand performance, track important metrics, and make better decisions. Reporting and analytics platforms make this process easier by bringing information from different sources into one place. Databox is a popular solution that helps businesses create dashboards, monitor KPIs, and share performance reports.
However, Databox may not be the right fit for every business. Some users may need advanced data visualization, flexible reporting, AI-powered analytics, or more control over their data. Others may prefer an affordable platform that works smoothly with their existing business tools and workflows.
This is why exploring the best Databox alternatives can help businesses find a solution that better matches their reporting and analytics needs. In this guide, we will cover 7 of the best Databox alternatives in 2027, comparing their features, pros, cons, pricing, and ideal use cases to help you choose the right platform.
Reasons to Explore Databox Alternatives
Databox offers useful reporting and dashboard features, but it may not meet every business requirement. As companies grow, their data needs, reporting processes, and analytics requirements can become more complex. Exploring alternatives can help businesses find tools that offer better flexibility, advanced features, and a suitable pricing structure.
- Advanced Analytics: Some platforms provide deeper data analysis, interactive reports, and advanced visualization options.
- Flexible Reporting: Alternative tools may offer more customization for dashboards, reports, and business metrics.
- AI-Powered Insights: Certain platforms use AI to help users explore data, identify patterns, and understand business performance.
- Better Data Integration: Businesses may need tools that connect with specific databases, cloud services, and business applications.
- Scalable Solutions: Growing companies may require analytics platforms that can handle larger datasets and more users.
- Different Pricing Options: Comparing alternatives can help businesses find a solution that better fits their budget and usage requirements.
- Specialized Features: Some tools focus on embedded analytics, self-service reporting, open-source dashboards, or spreadsheet-style data analysis.
Choosing the right alternative depends on your business goals, technical requirements, reporting needs, and budget. Comparing these factors can help you select a platform that supports your long-term growth.
🚀 Explore the Best Databox Alternatives
7 Best Databox Alternatives in 2027
| Tool | Best For | Key Features | Deployment Type | Ideal Users |
| Tableau | Advanced Data Visualization | Interactive dashboards, visual analytics | Cloud & Desktop | Analysts and enterprises |
| Qlik Cloud Analytics | Data Exploration | Associative analytics, AI insights | Cloud | Data-driven businesses |
| Sisense | Embedded Analytics | Embedded dashboards, data modeling | Cloud | Software companies |
| ThoughtSpot | AI-Powered Data Search | Natural language search, AI analytics | Cloud | Business and data teams |
| Metabase | Open-Source Analytics | SQL queries, interactive dashboards | Cloud & Self-hosted | Startups and developers |
| Sigma Computing | Spreadsheet-Style Analytics | Cloud data analysis, spreadsheet interface | Cloud | Finance and business teams |
| Amazon QuickSight | AWS-Based Reporting | BI dashboards, data visualization | Cloud | AWS users and enterprises |
These seven platforms offer different solutions for business intelligence, dashboard creation, data exploration, and reporting.
1. Tableau
Best For: Businesses, data analysts, and enterprises that need advanced data visualization, interactive dashboards, and detailed business intelligence.
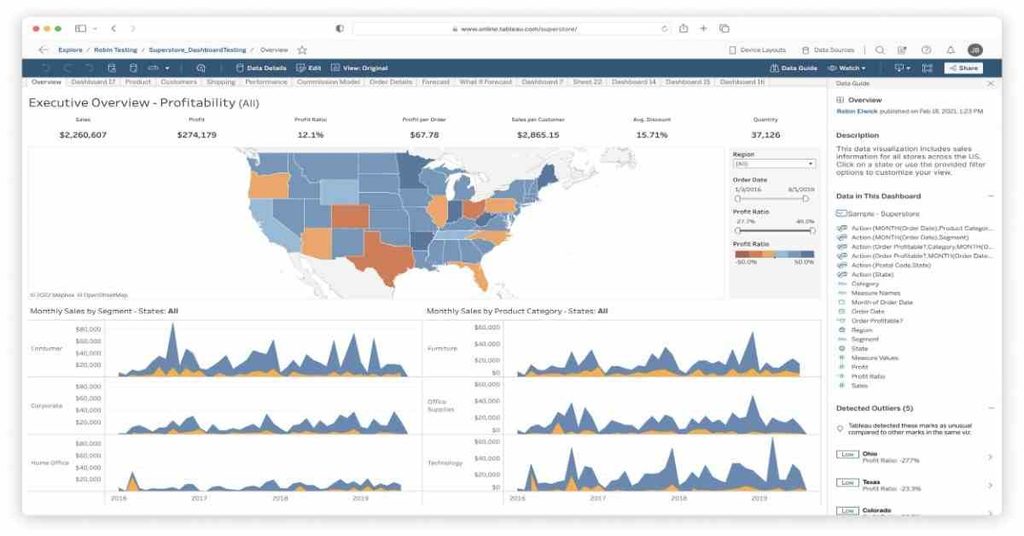
Tableau is a business intelligence platform that helps businesses turn complex data into interactive dashboards, charts, and reports. It connects information from different sources and makes it easier to identify trends and understand business performance. It is a strong Databox alternative for teams that need deeper data analysis and customized visual reporting.
Key Features
- Interactive Dashboards: Create customized dashboards with charts, graphs, and visual reports.
- Data Connectivity: Connect information from spreadsheets, databases, and cloud applications.
- Advanced Data Visualization: Explore complex datasets through different charts and visualization formats.
- Data Preparation: Clean, organize, and combine data using Tableau Prep Builder.
- AI-Powered Analytics: Use Tableau Pulse and eligible Tableau AI features to explore metrics and gain insights.
- Data Sharing: Share dashboards and reports with team members through Tableau Cloud.
- Mobile Access: View and interact with dashboards using Tableau mobile apps.
Services
- Business intelligence and data analytics
- Interactive dashboard development
- Data visualization and reporting
- Data preparation and management
- Enterprise analytics solutions
- Embedded analytics
Benefits & Limitations
| Benefits | Limitations |
| Offers advanced data visualization capabilities | Has a learning curve for beginners |
| Connects with multiple data sources | Can be expensive for larger teams |
| Provides highly customizable dashboards | Advanced features may require higher-tier plans |
| Supports detailed business reporting | Requires proper data preparation |
| Offers desktop data analysis options | Collaboration and sharing require paid services |
Pricing
Tableau offers different licensing options for individuals and businesses. Its Tableau Cloud pricing includes the following user licenses:
| License | Standard Edition | Enterprise Edition |
| Creator | $75/user/month | $115/user/month |
| Explorer | $42/user/month | $70/user/month |
| Viewer | $15/user/month | $35/user/month |
Prices are in USD and billed annually. Each Tableau Cloud deployment requires at least one Creator license. Tableau also offers a free Desktop edition for individual analysis, without online publishing and sharing features.
Review
Tableau is a powerful Databox alternative for businesses that need advanced analytics, detailed dashboards, and flexible data visualization. It works especially well for data analysts, enterprises, and teams handling complex datasets. However, smaller businesses may find its pricing and learning curve challenging compared with simpler reporting platforms.
2. Qlik Cloud Analytics
Best For: Businesses and data teams that need advanced data exploration, interactive analytics, and insights from multiple data sources.
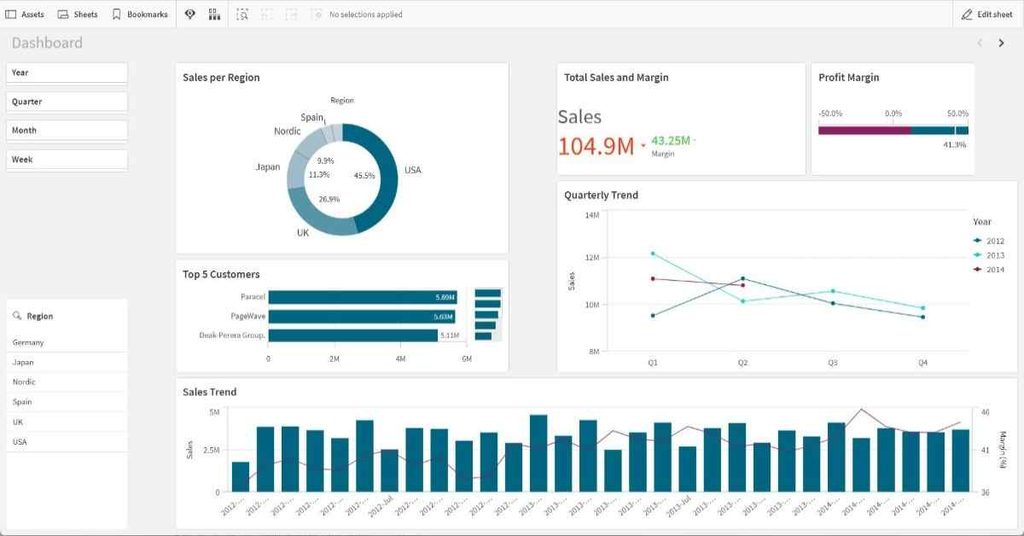
Qlik Cloud Analytics is a cloud-based analytics platform that helps businesses explore data, create dashboards, and understand important business trends. Its associative analytics engine allows users to explore relationships between different datasets rather than following only predefined reports. It is a useful Databox alternative for organizations that need flexible data discovery and deeper analysis.
Key Features
- Associative Analytics Engine: Explore relationships between different datasets and discover insights that traditional reporting may miss.
- Interactive Dashboards: Build customizable dashboards with charts, graphs, and visual reports.
- AI-Powered Insights: Get automated suggestions and insights to understand business performance.
- Data Integration: Connect and combine information from multiple databases, cloud platforms, and business applications.
- Predictive Analytics: Use machine learning features to identify trends and forecast possible outcomes.
- Natural Language Analytics: Ask questions about business data using conversational analytics.
- Automated Reporting: Schedule reports and distribute information to team members.
Services
- Business intelligence and data analytics
- Interactive dashboard development
- Data integration and exploration
- Predictive and AI-powered analytics
- Automated reporting and alerting
- Embedded analytics solutions
- Team collaboration and data sharing
Benefits & Limitations
| Benefits | Limitations |
| Powerful associative data exploration | Can be complex for beginners |
| Supports multiple data sources | Pricing may be high for small businesses |
| Provides AI-powered insights | Advanced features may require higher plans |
| Offers interactive dashboards | Requires proper data preparation |
| Includes predictive analytics capabilities | Some features need technical knowledge |
| Supports team collaboration | Capacity-based pricing can be difficult to estimate |
Pricing
Qlik Cloud Analytics offers four main subscription plans with annual billing.
| Plan | Starting Price |
| Starter | $300/month |
| Standard | $825/month |
| Premium | $2,750/month |
| Enterprise | Custom Pricing |
Prices are in USD and billed annually. Starter includes 10 users and 10 GB of data for analysis. Standard starts with 25 GB, while Premium starts with 50 GB. Enterprise pricing is customized.
Review
Qlik Cloud Analytics is a strong Databox alternative for businesses that need advanced data exploration, interactive dashboards, and AI-powered insights. Its associative engine helps teams discover relationships and patterns across different datasets. However, its pricing and advanced capabilities may be more suitable for growing businesses and larger organizations than very small teams.
3. Sisense
Best For: Software companies and businesses that want to add interactive analytics and reporting features directly into their applications.
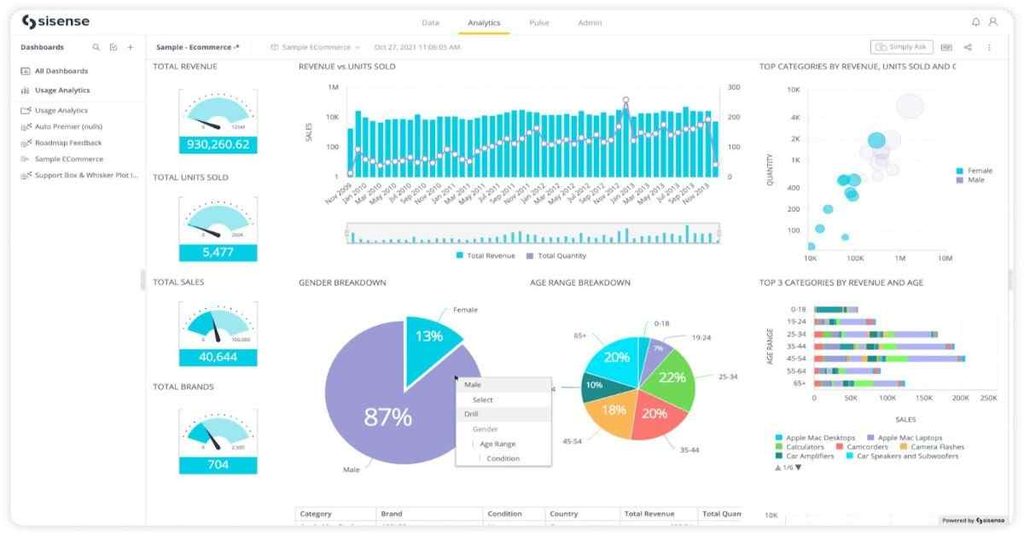
Sisense is an analytics platform that helps businesses connect data, create dashboards, and deliver insights within their own applications. It offers embedded analytics, customizable visualizations, and AI-powered tools for exploring business information. It is a strong Databox alternative for companies that want to provide reporting experiences directly to their customers.
Key Features
- Embedded Analytics: Add interactive dashboards and reports directly into websites and business applications.
- Customizable Dashboards: Build visual reports with charts, filters, and interactive components.
- Data Integration: Connect information from databases, cloud platforms, and third-party applications.
- AI-Powered Assistant: Use natural language to ask questions, explore data, and create analytics.
- Data Modeling: Combine, organize, and prepare information for accurate reporting.
- Predictive Analytics: Identify trends, understand performance changes, and explore future outcomes.
- Developer Tools: Use APIs and SDKs to customize and integrate analytics into applications.
Services
- Embedded business intelligence
- Custom analytics and dashboard development
- Data integration and modeling
- AI-powered data analysis
- Interactive reporting and visualization
- Enterprise analytics solutions
- Application-based reporting
Benefits & Limitations
| Benefits | Limitations |
| Powerful embedded analytics capabilities | May require technical expertise |
| Supports customized dashboards and reports | Initial setup can be complex |
| Connects with different data sources | Pricing may not suit smaller businesses |
| Includes AI-powered analytics features | Some advanced features depend on plan and configuration |
| Offers flexible APIs and SDKs | Requires data modeling for complex projects |
| Supports scalable business applications | Can be more than needed for basic reporting |
Pricing
Sisense offers different plans for startups, growing teams, and enterprises. Its current pricing structure includes self-service and enterprise options.
| Plan | Pricing |
| Self-Serve | Contact Sisense / Try Free |
| Enterprise | Custom Pricing |
Sisense does not publish fixed prices for these plans on its official pricing page. Costs depend on business requirements, deployment, and analytics needs.
Review
Sisense is a useful Databox alternative for software companies and businesses that want to integrate analytics directly into their products. Its embedded dashboards, AI features, and developer tools provide flexibility for customized reporting experiences. However, businesses looking only for simple KPI tracking may find its setup and capabilities more complex than necessary.
4. ThoughtSpot
Best For: Businesses and data teams that want to analyze data using natural language searches, AI-powered insights, and interactive dashboards.
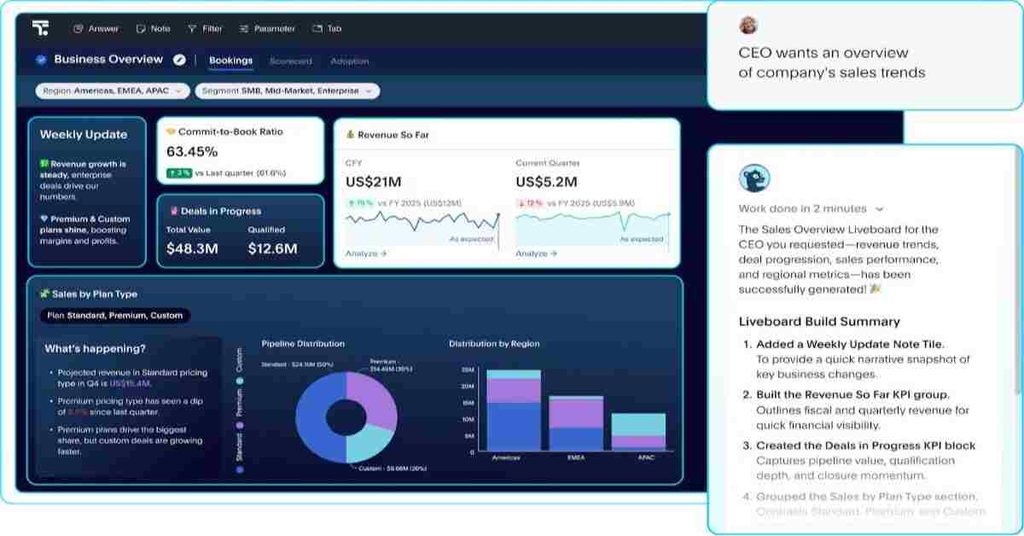
ThoughtSpot is a business intelligence platform that helps users explore business data by asking questions in everyday language. Its AI-powered analytics features make it easier to find insights, create dashboards, and understand important business metrics without writing complex SQL queries. It is a useful Databox alternative for teams that want faster data exploration and self-service reporting.
Key Features
- Natural Language Search: Ask questions about business data using everyday language.
- AI-Powered Analytics: Use Spotter AI to explore data and receive insights.
- Interactive Liveboards: Create dashboards with charts, metrics, and visual reports.
- Automated Insights: Identify trends, changes, and unusual patterns in business data.
- Data Connectivity: Connect with cloud data platforms such as Snowflake, Databricks, and Amazon Redshift.
- Data Modeling: Create governed data models for consistent reporting.
- Embedded Analytics: Add interactive analytics experiences to business applications.
Services
- AI-powered business intelligence
- Natural language data search
- Interactive dashboard creation
- Automated data analysis
- Data modeling and management
- Embedded analytics solutions
- Business performance reporting
Benefits & Limitations
| Benefits | Limitations |
| Makes data exploration easier with natural language | Requires well-prepared and modeled data |
| Offers AI-powered analytics features | Advanced features may require higher plans |
| Supports interactive dashboards | Can take time to learn |
| Connects with modern cloud data platforms | Pricing may be high for small teams |
| Helps reduce manual reporting work | Some integrations require technical setup |
| Supports embedded analytics | May be more advanced than basic reporting needs |
Pricing
ThoughtSpot offers different plans for teams, businesses, and developers.
| Plan | Pricing |
| Essentials | From $25/user/month |
| Pro | From $50/user/month |
| Enterprise | Custom Pricing |
| Developer | Free for 1 year |
Prices are in USD and billed annually where applicable. Usage-based pricing is also available, starting at $0.10 per credit. Features and limits vary by plan.
Review
ThoughtSpot is a strong Databox alternative for businesses that want to make data analysis easier with AI and natural language search. Its interactive Liveboards and automated insights help teams explore business performance without depending entirely on technical analysts. However, businesses should consider its pricing and data preparation requirements before choosing it.
5. Metabase
Best For: Startups, small businesses, developers, and data teams looking for flexible and affordable analytics software.
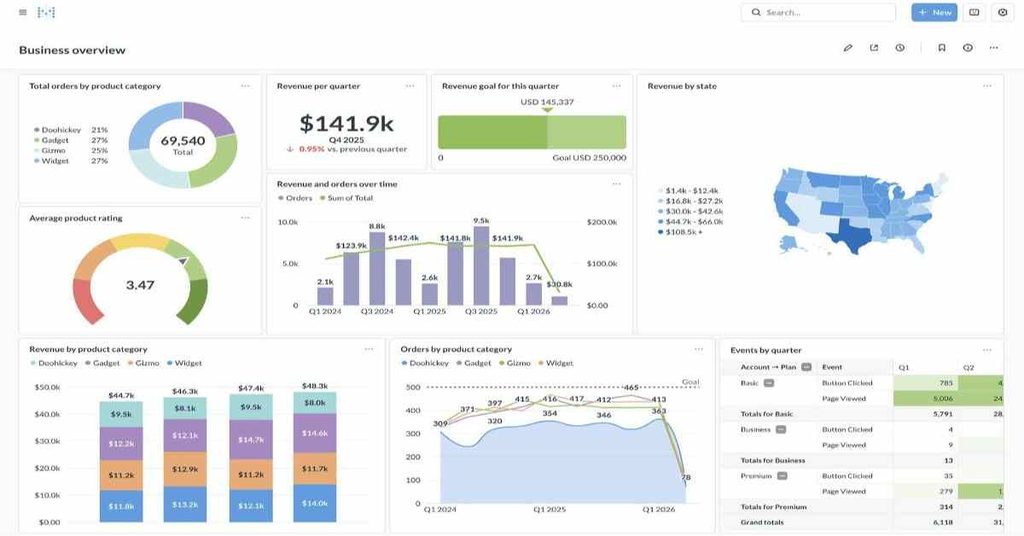
Metabase is an open-source business intelligence platform that helps businesses explore data, create dashboards, and generate reports. It allows users to connect databases, build queries, and visualize information without requiring advanced technical skills. It is a useful Databox alternative for businesses that want more control over their analytics setup and reporting workflows.
Key Features
- Interactive Dashboards: Create dashboards with charts, metrics, and visual reports.
- Visual Query Builder: Explore data using a simple point-and-click interface.
- SQL Editor: Write custom SQL queries for more advanced data analysis.
- Database Connectivity: Connect with databases and data warehouses such as PostgreSQL, MySQL, and Snowflake.
- AI-Powered Analytics: Ask questions about data and generate SQL using supported AI features.
- Data Visualization: Present information through charts, graphs, and tables.
- Embedded Analytics: Add dashboards and reports to websites and business applications.
Services
- Business intelligence and data analytics
- Interactive dashboard creation
- SQL-based data reporting
- Database integration
- Data visualization
- Embedded analytics
- Self-hosted analytics solutions
Benefits & Limitations
| Benefits | Limitations |
| Offers a free open-source edition | Self-hosting requires technical knowledge |
| Easy-to-use visual query builder | Advanced customization may require SQL |
| Supports multiple databases | Some enterprise features require paid plans |
| Provides interactive dashboards | Limited advanced visualization compared with some BI tools |
| Supports cloud and self-hosted deployment | Hosting and maintenance are your responsibility when self-hosted |
| Offers AI-powered data exploration | Some AI features require an external model or additional usage costs |
Pricing
Metabase offers a free open-source version and paid cloud and enterprise plans.
| Plan | Pricing |
| Open Source | Free |
| Starter | $100/month |
| Pro | $575/month |
| Enterprise | Custom Pricing |
Prices are in USD. Annual billing reduces Starter to $90/month and Pro to $517.50/month. Paid plans include different user allowances and additional features.
Review
Metabase is a practical Databox alternative for businesses that want simple dashboards, database connectivity, and flexible reporting options. Its open-source edition makes it attractive to startups and technical teams that prefer managing their own analytics environment. However, businesses needing advanced enterprise reporting and extensive customization may need a paid plan or additional technical support.
6. Sigma Computing
Best For: Businesses, finance teams, and data analysts that prefer spreadsheet-style reporting and want to analyze live data from cloud warehouses.
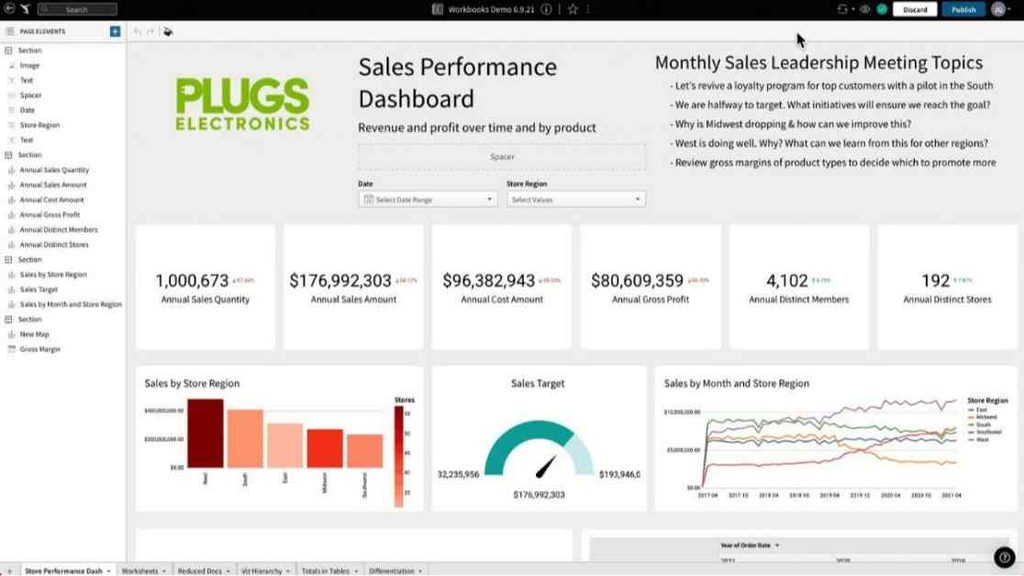
Sigma Computing is a cloud-based analytics platform that helps businesses explore, analyze, and visualize data through a familiar spreadsheet-style interface. It connects directly to cloud data warehouses, allowing users to work with large datasets without constantly exporting information into spreadsheets. It is a useful Databox alternative for teams that want flexible data analysis and collaborative reporting.
Key Features
- Spreadsheet-Style Interface: Analyze business data using familiar spreadsheet functions, formulas, and tables.
- Live Data Connectivity: Connect directly to cloud data warehouses such as Snowflake, BigQuery, and Databricks.
- Interactive Dashboards: Create reports with charts, tables, filters, and visual components.
- Data Exploration: Filter, group, pivot, and analyze large datasets without writing complex SQL queries.
- Real-Time Collaboration: Allow team members to work together on reports and analytics.
- AI-Powered Analytics: Use AI-assisted tools to explore data and generate insights.
- Data Writeback: Enter information and send supported changes back to connected data warehouses.
Services
- Cloud-based business intelligence
- Spreadsheet-style data analytics
- Interactive dashboard development
- Data exploration and reporting
- Cloud data warehouse integration
- Embedded analytics
- Data modeling and collaboration
Benefits & Limitations
| Benefits | Limitations |
| Familiar spreadsheet-style interface | Pricing is not publicly listed |
| Connects directly to cloud data warehouses | Requires a supported data warehouse |
| Supports large-scale data analysis | Warehouse usage may create additional costs |
| Offers interactive dashboards and reports | No permanent free plan |
| Supports team collaboration | Cloud-only deployment |
| Provides AI-assisted analytics | Advanced features may require training |
Pricing
Sigma Computing uses a custom pricing model based on business requirements, user roles, and usage.
| Plan / Option | Pricing |
| Free Trial | Available |
| View License | Custom Pricing |
| Act License | Custom Pricing |
| Analyze License | Custom Pricing |
| Build License | Custom Pricing |
| Enterprise | Contact Sales |
Sigma does not publish standard subscription prices. Contact its sales team for a quote based on your team’s requirements. A limited free trial is available.
Review
Sigma Computing is a good Databox alternative for businesses that prefer spreadsheet-style analytics and need to work directly with live warehouse data. Its collaborative workbooks, interactive dashboards, and data exploration features make reporting easier for business and finance teams. However, its custom pricing and dependence on cloud data warehouses may not suit smaller businesses looking for a simple, low-cost reporting tool.
7. Amazon QuickSight
Best For: Businesses using AWS services that need cloud-based reporting, interactive dashboards, and scalable business intelligence.
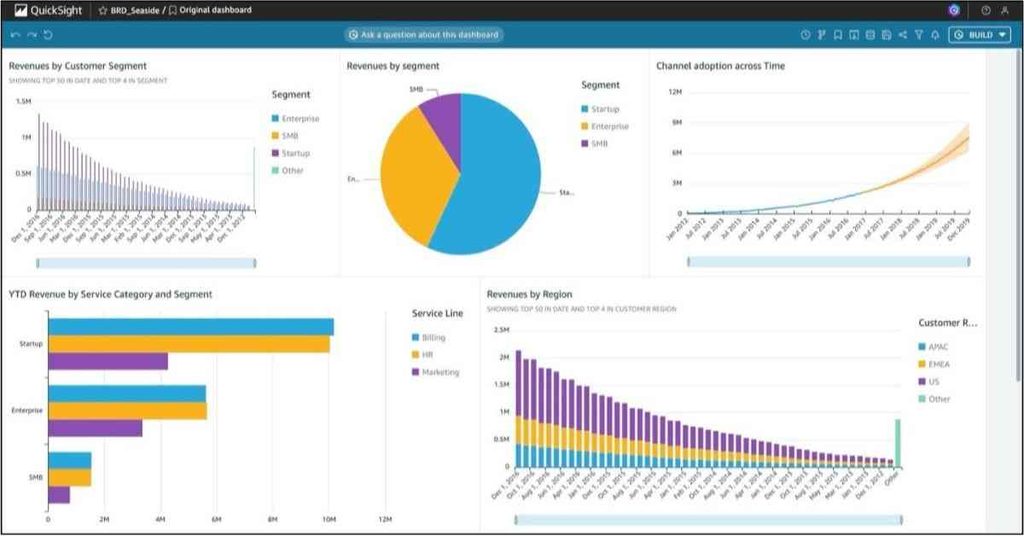
Amazon QuickSight is a cloud-based business intelligence platform from Amazon Web Services (AWS). It helps businesses connect data, create interactive dashboards, and share reports across teams. It is a useful Databox alternative for organizations already working with AWS services and looking for scalable analytics solutions.
Key Features
- Interactive Dashboards: Create dashboards with charts, graphs, and visual reports.
- AWS Data Integration: Connect with Amazon S3, Amazon Redshift, Amazon Athena, and other supported data sources.
- AI-Powered Analytics: Use Amazon Q to ask questions and explore business data using natural language.
- Automated Reporting: Schedule and distribute reports to team members.
- Data Visualization: Present business information through customizable charts and visualizations.
- SPICE Engine: Use its in-memory calculation engine to improve analytics performance.
- Embedded Analytics: Add dashboards and reports to websites and business applications.
Services
- Cloud-based business intelligence
- Interactive dashboard development
- AWS data analytics and integration
- Automated reporting and data sharing
- AI-powered business analytics
- Embedded analytics solutions
- Data visualization and KPI monitoring
Benefits & Limitations
| Benefits | Limitations |
| Integrates well with AWS services | Less convenient for businesses outside the AWS ecosystem |
| Offers flexible usage-based pricing | Costs can become difficult to estimate |
| Supports interactive dashboards | Advanced setup may require technical knowledge |
| Includes AI-powered analytics features | Some AI capabilities require higher-priced licenses |
| Scales for large analytics workloads | Data preparation may take time |
| Supports embedded reporting | Additional infrastructure and capacity charges may apply |
Pricing
Amazon QuickSight offers different pricing options based on user roles and usage.
| User Type | Price |
| Reader | $3/user/month |
| Reader Pro | $20/user/month |
| Author | $24/user/month |
| Author Pro | $40/user/month |
Prices are in USD. Capacity-based pricing is also available for larger deployments. A $250/month account infrastructure fee applies in certain Pro and Amazon Q configurations.
Review
Amazon QuickSight is a useful Databox alternative for businesses that already use AWS and need scalable cloud-based reporting. Its interactive dashboards, flexible pricing models, and Amazon Q features help teams explore data and monitor business performance. However, businesses unfamiliar with AWS may find its setup and pricing structure more complicated.
Key Considerations Before Switching Platforms
Moving from Databox to another analytics platform is an important business decision. Before making the switch, businesses should understand their reporting needs, existing data setup, and future goals. The following considerations can help make the transition easier.
1. Data Compatibility
Check whether the new platform supports your existing databases, spreadsheets, marketing tools, and business applications. Proper compatibility helps maintain your reporting workflow.
2. Migration Requirements
Review how your existing dashboards, historical reports, KPIs, and data connections will move to the new platform. Prepare a migration plan to avoid losing important business information.
3. Budget and Subscription Costs
Compare subscription fees, user licenses, implementation expenses, and additional usage charges. Choose a platform that provides the features you need within your available budget.
4. Team Training
Consider how easily your employees can learn the new software. Provide training and documentation to help team members understand its reporting and analytics features.
5. Security and Permissions
Review data protection features, user access controls, authentication options, and compliance requirements before transferring sensitive business information.
6. Integration and Scalability
Make sure the platform works with your existing tools and can support future business growth, additional users, and increasing data volumes.
7. Testing Before Switching
Use free trials or product demonstrations to test dashboards, integrations, reporting accuracy, and other important features before purchasing a subscription..
Databox vs. Alternative Tools: Key Differences
Databox is designed to make KPI tracking, dashboard creation, and business reporting easier through connected data sources and ready-made metrics. However, other analytics platforms offer specialized capabilities for advanced visualization, data exploration, AI-powered analysis, and embedded reporting. Understanding these differences can help businesses choose the right platform for their reporting needs.
| Tool | Main Focus | Data Analysis | Dashboard Customization | Ideal Business Type |
| Databox | KPI Tracking & Reporting | Performance metrics and AI insights | Easy and flexible | Marketing teams and businesses |
| Tableau | Data Visualization | Advanced visual analytics | Highly customizable | Analysts and enterprises |
| Qlik Cloud Analytics | Data Exploration | Associative and predictive analytics | Advanced | Data-driven organizations |
| Sisense | Embedded Analytics | Application-based analytics | Highly customizable | Software companies |
| ThoughtSpot | AI-Powered Analytics | Natural language data search | Interactive Liveboards | Business and data teams |
| Metabase | Open-Source BI | SQL and visual queries | Flexible | Startups and developers |
| Sigma Computing | Spreadsheet Analytics | Cloud warehouse analysis | Spreadsheet-style workbooks | Finance and business teams |
| Amazon QuickSight | AWS-Based BI | Cloud data analytics | Interactive dashboards | AWS-based businesses |
Major Differences Between Databox and Its Alternatives
- Ease of Use: Databox focuses on simple KPI tracking and reporting, while platforms like Tableau and Qlik offer more advanced analytics capabilities.
- Data Visualization: Tableau provides deeper visualization customization, whereas Databox focuses on accessible business dashboards.
- AI Capabilities: ThoughtSpot and Qlik offer specialized AI-powered data exploration features.
- Embedded Reporting: Sisense is particularly useful for businesses that want to integrate analytics into their own applications.
- Open-Source Flexibility: Metabase provides a self-hosted open-source option, giving businesses more control over their analytics environment.
- Cloud Data Analysis: Sigma Computing and Amazon QuickSight are useful for organizations working with cloud data warehouses and AWS services.
Overall, Databox is suitable for businesses that prioritize straightforward KPI monitoring and automated reporting. However, companies needing specialized analytics, deeper customization, or application-based reporting may find one of these alternatives more suitable.
Top Databox Alternatives by Business Use Case
Not every business needs the same type of reporting and analytics platform. Some companies focus on advanced data visualization, while others need AI-powered insights, embedded dashboards, or affordable reporting solutions. Choosing a tool based on your business requirements can help you get better results and manage data more effectively.
Best Tools for Different Business Needs
- For Advanced Data Visualization – Tableau: Best for businesses that need interactive charts, customized dashboards, and detailed visual reporting.
- For Data Exploration – Qlik Cloud Analytics: Suitable for organizations that want to discover relationships between datasets and explore complex business information.
- For Embedded Analytics – Sisense: A good choice for software companies that want to add reporting and analytics features directly into their applications.
- For AI-Powered Reporting – ThoughtSpot: Ideal for teams that want to search business data using natural language and receive AI-powered insights.
- For Budget-Friendly Analytics – Metabase: Suitable for startups and small businesses looking for open-source reporting and self-service dashboards.
- For Spreadsheet-Based Analysis – Sigma Computing: Best for finance teams and analysts who prefer spreadsheet-style workflows with live cloud data.
- For AWS-Based Businesses – Amazon QuickSight: A suitable option for organizations already using AWS services and looking for scalable cloud reporting.
Benefits of Switching to Another Analytics Platform
Switching from Databox to another analytics platform can help businesses improve their reporting workflows, explore data more effectively, and access features that better match their requirements. Different business intelligence tools offer specialized capabilities for data visualization, automation, integration, and advanced analysis. Choosing the right platform can make business reporting more flexible and useful.
Key Benefits of Switching
- Advanced Data Analysis: Explore complex datasets, identify patterns, and understand business performance with more advanced analytics features.
- Better Data Visualization: Create interactive charts, customized dashboards, and detailed reports to present information clearly.
- Flexible Reporting: Customize reports and dashboards according to different business goals, departments, and performance metrics.
- Improved Data Integration: Connect information from multiple databases, cloud platforms, and business applications in one analytics environment.
- AI-Powered Insights: Use AI features and natural language analytics to explore data and discover useful business insights.
- Automated Reporting: Schedule reports, monitor important metrics, and reduce repetitive manual reporting tasks.
- Better Scalability: Choose a platform that can support increasing data volumes, additional users, and changing business requirements.
- Cost Management: Compare different pricing models and select a platform that fits your budget and expected usage.
How Switching Can Help Different Teams
| Team | Potential Benefit |
| Marketing | Better campaign analysis and performance reporting |
| Sales | Improved revenue tracking and sales dashboards |
| Finance | Detailed financial analysis and reporting |
| Operations | Better workflow monitoring and performance insights |
| Management | Centralized business data for decision-making |
| Data Teams | Advanced data exploration and visualization |
Essential Features to Look for in a Reporting Tool
Choosing the right reporting platform requires more than comparing dashboards and subscription plans. Businesses should consider the features that support their daily analytics activities, data management, and reporting goals. A suitable tool should make it easier to collect information, analyze performance, and share useful insights with team members.
Important Features to Consider
- Data Source Integrations: Look for a platform that connects with your existing databases, spreadsheets, cloud services, and business applications.
- Customizable Dashboards: Choose software that allows you to create dashboards based on specific KPIs, business goals, and reporting requirements.
- Advanced Data Visualization: Charts, graphs, tables, and interactive reports help users understand complex information more easily.
- Automated Reporting: Scheduled reports and automated updates can reduce repetitive work and save time.
- AI and Predictive Analytics: AI-powered insights, natural language searches, and forecasting features can help teams explore data more efficiently.
- Data Security: Check for access controls, encryption, user permissions, and other security features to protect business information.
- Collaboration Options: Sharing dashboards, managing user access, and working together on reports can improve team productivity.
- Scalability: Select a tool that can support growing datasets, additional users, and more complex reporting needs.
- Ease of Use: A simple interface and accessible reporting features can reduce the learning curve for new users.
- Pricing Flexibility: Compare subscription plans, user limits, data capacity, and additional usage costs before making a decision.
Evaluation Criteria for the Best Databox Alternatives
Selecting the best Databox alternatives requires comparing different analytics platforms based on their performance, features, usability, and overall value. Each tool offers different capabilities, so businesses should evaluate how well it supports their reporting requirements and daily workflows. A proper evaluation also helps identify platforms that provide useful features without unnecessary complexity or expenses.
Key Evaluation Factors
- Features and Functionality: We considered dashboard creation, data visualization, reporting automation, data exploration, and AI-powered analytics capabilities.
- Ease of Use: We looked at how easily beginners, business users, and data professionals can navigate the platform and create reports.
- Data Integrations: We considered support for databases, spreadsheets, cloud platforms, and commonly used business applications.
- Customization: We evaluated how much control users have over dashboards, charts, reports, and analytics workflows.
- Pricing and Value: We compared available pricing information, subscription options, and features offered at different levels.
- Scalability: We considered whether each platform can support growing businesses, larger datasets, and additional users.
- Security and Access Control: We reviewed available data protection, permissions, and user management capabilities.
- Customer Support and Resources: We considered documentation, learning resources, support options, and community assistance.
Common Issues During Analytics Platform Migration
Switching from Databox to another analytics platform can improve reporting capabilities, but the migration process may create some challenges. Businesses need to prepare for technical, operational, and data-related issues to avoid interruptions. Understanding these common problems can help teams manage the transition more effectively.
1. Data Transfer Problems
Moving historical reports, dashboards, and business information between platforms may create compatibility issues or missing data.
Solution: Back up important information and verify migrated data before fully switching platforms.
2. Integration Difficulties
Some analytics platforms may not support every application or data source used by your business.
Solution: Check integration compatibility and available connectors before selecting a replacement.
3. Dashboard Recreation
Existing Databox dashboards and KPI configurations may not transfer directly to another platform.
Solution: Identify essential dashboards and recreate them using the new platform's customization features.
4. Employee Adjustment
Employees may need time to understand a new interface, reporting process, and analytics workflow.
Solution: Provide practical training, documentation, and internal support.
5. Unexpected Costs
Additional user licenses, data storage, implementation, and premium features can increase the overall migration cost.
Solution: Review the complete pricing structure and calculate expected expenses before purchasing.
6. Reporting Inconsistencies
Different platforms may calculate metrics differently, which can create variations in reports and performance measurements.
Solution: Compare important KPIs between the old and new platforms to confirm reporting accuracy.
7. Workflow Disruptions
Changing reporting systems can temporarily affect regular business operations and scheduled reports.
Solution: Plan the migration in stages and keep the previous platform available until the new system is properly tested.
Handling these challenges with proper preparation can make analytics platform migration easier. Businesses should test integrations, verify important reports, and train employees before completely replacing their existing reporting system.
Final Verdict
Choosing the right platform from the best Databox alternatives depends on your business goals, reporting requirements, budget, and technical needs. Each tool offers different capabilities, from advanced data visualization to AI-powered analytics and embedded reporting.
Tableau is a strong choice for advanced visualizations, while Qlik Cloud Analytics supports flexible data exploration. Sisense works well for embedded analytics, and ThoughtSpot offers AI-powered data search. Businesses looking for open-source reporting can consider Metabase, while Sigma Computing provides a familiar spreadsheet-style experience. Amazon QuickSight is worth considering for organizations already using AWS.
Before making a decision, compare features, integrations, pricing, scalability, and ease of use. Take advantage of free plans, demos, or trials where available. The best alternative is the one that helps your team turn business data into clear insights and better decisions without unnecessary complexity.
FAQ’s
1. What are the best Databox alternatives?
Some of the best Databox alternatives include Tableau, Qlik Cloud Analytics, Sisense, ThoughtSpot, Metabase, Sigma Computing, and Amazon QuickSight. Each platform offers different reporting and analytics capabilities.
2. Which Databox alternative is best for data visualization?
Tableau is a strong option for advanced data visualization. It helps users create interactive dashboards, charts, and detailed reports from multiple data sources.
3. Which alternative is best for AI-powered analytics?
ThoughtSpot is a good choice for AI-powered analytics. It allows users to explore business data through natural language searches and AI-driven insights.
4. Is there a free alternative to Databox?
Metabase offers a free open-source edition that businesses can host themselves. It provides SQL querying, dashboards, and data exploration features.
5. Which Databox alternative is best for embedded analytics?
Sisense is designed for embedded analytics. Businesses can integrate dashboards and reporting features directly into their applications and products.
6. Is Tableau better than Databox?
Tableau offers more advanced data visualization and analytical capabilities, while Databox focuses on accessible KPI tracking and business dashboards. The better option depends on your reporting needs and technical requirements.
7. Which alternative is best for AWS users?
Amazon QuickSight is a suitable option for businesses using AWS services. It supports cloud-based business intelligence, interactive dashboards, and data visualization.
8. Which Databox alternative is best for spreadsheet-style reporting?
Sigma Computing provides a spreadsheet-style interface for analyzing cloud data. It is useful for finance and business teams familiar with spreadsheets.
9. What should businesses consider before switching from Databox?
Businesses should evaluate pricing, data integrations, dashboard customization, security, scalability, and ease of use. They should also test the new platform before completing the migration.
10. How do I choose the right Databox alternative?
Start by identifying your business reporting requirements, preferred data sources, team size, and budget. Compare the available platforms and test their features to find the solution that best fits your workflow.